Don’t you love this:
Transaction (Process ID 60) was deadlocked on lock resources with another process and has been chosen as the deadlock victim. Rerun the transaction.
SQL helpfully tells you that your process was chosen as the deadlock victim but doesn’t tell you who “another process” was and what the deadlock was on? Certainly makes debugging fun and exciting. It turns out that SQL Profiler has some nice functionality for just this purpose.
First let’s find a way to reliably reproduce a deadlock. Let’s create a couple of tables using the following script:
CREATE TABLE TableA(
    TableAId INT IDENTITY(1,1) NOT NULL,
    SomeValue NVARCHAR(50) NOT NULL,
)
GO

CREATE TABLE TableB(
    TableBId INT IDENTITY(1,1) NOT NULL,
    SomeOtherValue NVARCHAR(50) NOT NULL,
)
GO
Now lets create the following tow stored procedures:
CREATE PROCEDURE ProcedureA
AS
BEGIN
	BEGIN TRANSACTION

	INSERT INTO TableA WITH (TABLOCKX) (
			SomeValue)
		VALUES (
			'SomeValue A')

	WAITFOR DELAY '00:00:10'

	INSERT INTO TableB WITH (TABLOCKX) (
			SomeOtherValue)
		VALUES (
			'SomeOther Value A')

	COMMIT TRANSACTION
END
GO

CREATE PROCEDURE ProcedureB
AS
BEGIN
	BEGIN TRANSACTION

	INSERT INTO TableB WITH (TABLOCKX) (
			SomeOtherValue)
		VALUES (
			'SomeValue B')

	INSERT INTO TableA WITH (TABLOCKX) (
			SomeValue)
		VALUES (
			'SomeOther Value B')

	COMMIT TRANSACTION
END
GO
Note that I’ve added a WAITFOR statement between the first and second INSERT statements in ProcedureA. This will allow us to start ProcedureA in one window and give us enough time to start ProcedureB and create a deadlock in a second window. Go ahead and give it a try. One of them will be chosen as the deadlock victim.
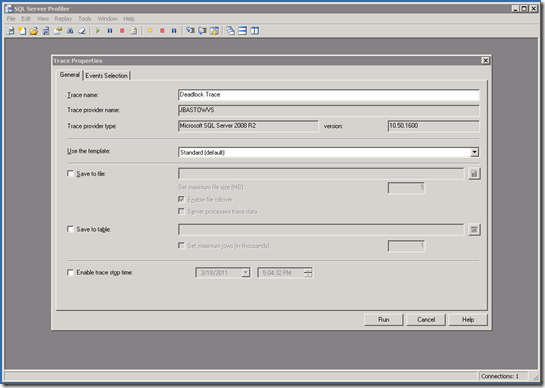
OK. Now that we can create one ourselves, how do we go about debugging it? First, open up SQL Profiler. You’ll get to the initial window to define your trace:

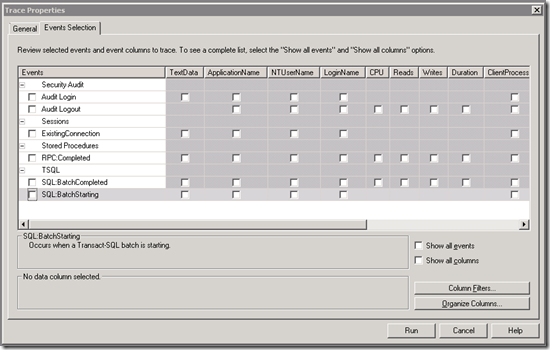
I’ve renamed mine Deadlock Trace. Probably would have left it untitled if it hadn’t been for a blog entry. Next go to the Event Selection tab and remove all of the existing selections as follows:

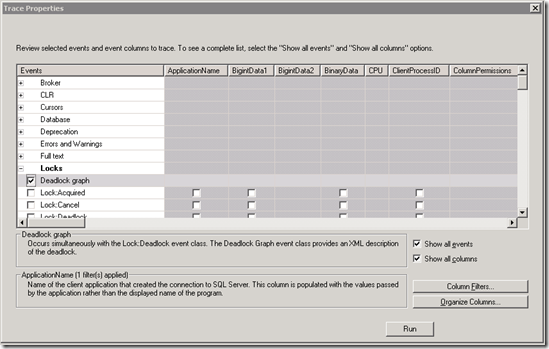
Once you have a clean slate, click on the Show all events and Show all columns checkboxes down on the lower right. Now you can pick the deadlock graph event from under the Locks group as follows:

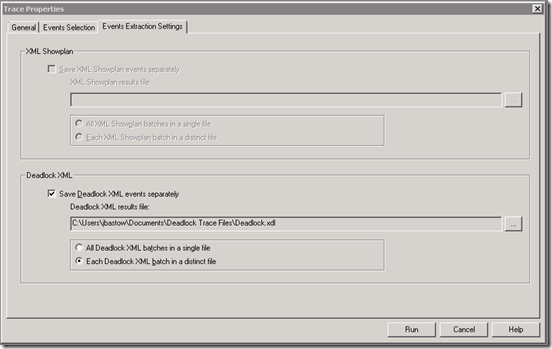
When you do this, you’ll notice that there’s now a third tab, Events Extraction Settings. Navigate to this tab and you’ll be able to specify that profiler should write the deadlock information to a file and where as follows:

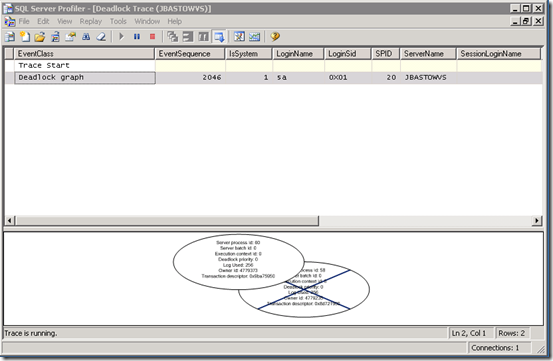
Note that I’ve chosen to have it write each deadlock to its own file. I’ve found that to be much more convenient when reading them. Now hit Run and off it goes. Go back to SSMS and run our test procedures again to produce another deadlock. When that’s completed, switch back to Profiler and you’ll see the following:

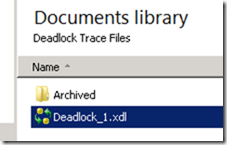
There you go. Debug away. OK, it’s not showing much more than we got before. We know there were two processes, they deadlocked and one was killed. Time to navigate explorer to the folder we told it to save the deadlocks in. You should see a deadlock trace file as follows:

Now if you simply double-click on it it will open up in Profiler with the same graphical view we got above. Since it’s just an XML file, open it up in the text/XML editor of your choice. This file contains a wealth of information to help you resolve deadlock issues. It’s a little large so I’m not going to include it the whole thing here but here’s some key parts:
<deadlock-list>
<deadlock victim="process4ad288">
<process-list>
<process id="process4ad288" clientoption2="390200" clientoption1="671090784" locktimeout="4294967295" currentdb="11" xactid="4791721" isolationlevel="read committed (2)" loginname="SILKROADTECH\jbastow" hostpid="6456" hostname="JBASTOWVS" clientapp="Microsoft SQL Server Management Studio - Query" lastbatchcompleted="2011-03-18T16:42:10.440" lastbatchstarted="2011-03-18T16:48:44.960" trancount="2" priority="0" ecid="0" sbid="0" spid="58" status="suspended" kpid="7072" schedulerid="4" lockmode="X" xdes="0x800ff950" lasttranstarted="2011-03-18T16:48:44.960" transactionname="user_transaction" ownerid="4791721" waittime="2577" waitresource="OBJECT: 11:1893581784:0 " logused="256" taskpriority="0">
<executionstack>
<frame sqlhandle="0x03000b00f4320d6d38a90201aa9e00000100000000000000" stmtend="568" stmtstart="368" line="13" procname="PlayPen.dbo.ProcedureA">
INSERT INTO TableB WITH (TABLOCKX) (
SomeOtherValue)
VALUES (
&apos;SomeOther Value A&apos;) </frame>
At the top you’ll note it specifies the specific process that was the victim. Below that is a process list that shows the details of each process involved in the deadlock, including the stored procedure, if appropriate. It even shows which statements within the transaction are deadlocked.
After the process list node you’ll see the resource list node. this lists each of the objects (tables, indexes, etc.) that are locked as part of the deadlock, and the type of lock each process has, or is attempting to acquire.
<resource-list>
 <objectlock lockPartition="0" objid="1893581784" subresource="FULL" dbid="11" objectname="PlayPen.dbo.TableB" id="lock80022c80" mode="X" associatedObjectId="1893581784">
  <owner-list>
   <owner id="process493708" mode="X"/>
  </owner-list>
  <waiter-list>
   <waiter id="process4ad288" mode="X" requestType="wait"/>
  </waiter-list>
 </objectlock>
OK. Now that you know how to diagnose your deadlocks, get going fixing them!
You can read more on MSDN in:
Analyzing Deadlocks with SQL Server Profiler
