Wednesday, July 20, 2011

WhatIs-PowerShell -?

PowerShell is Microsoft’s scripting alternative to ye olde DOS command line.  Although it shares many of it’s concepts, it it immensely more flexible and extensible.

It’s primary purpose is to allow system admins to accomplish more through a command line interface and scripts using a more standard command syntax than the collection of DOS commands, VBScripts and random executables that are available with the standard cmd.exe interface.

At it’s base it’s an interactive shell that allows you to type commands and view the results.  Like the DOS command line, you can create script files (.PS1 instead of .BAT).  Unlike the DOS command line you can load extensions in the form of Snap-ins and Modules (Snap-Ins are a version 1 concept that can still be loaded but have largely been replaced by Modules in version 2).

CmdLets & Providers

There are two important concepts in PowerShell, CmdLets and Providers.

CmdLets are commands you type at the command line such as Set-Location and Get-ChildItem.  Note that these can be aliased.  You can type Del *.txt and it will delete all text files in the current folder because Del is an alias of Remove-Item. 
You’ll notice that the non-aliased naming convention for CmdLets is Verb-Object.  Not only that, but if you define a CmdLet or function that doesn’t use one of the pre-defined verbs, PowerShell will yell at you, although it will still function correctly (You can get a list of approved verbs by typing Get-Verb).

Providers on the other hand allow you to navigate systems through a folder system.  The most obvious is the file system.  The File System provider allows you to type CD C:\Users (translates to Set-Location C:\Users) which will set your current location to the C:\Users folder.

However, unlike the DOS command line, we’re no longer limited to the file system.  Load up the SQL Server provider, type CD SQL:\MYSQLSERVER\DEFAULT\Databases\MyDatabase\Tables, type Dir (translates to Get-ChildItem) and you’ll get a list of the tables in the MyDatabase database on the default SQL instance on MYSSQLSERVER.   there are also providers for the registry and IIS, allowing for easy navigation.

Tuesday, July 19, 2011

Hello-PowerShell

So I’m going to go way off the data track for a few posts.  I’ve been working on a data integration project to better integrate our customer’s and our products.  As a SAAS company, I don’t need to write polished MSI installer for public consumption, but I do have to write an installer that will allow our IT staff to deploy and update thousands of instances used by our customers, and as my boss likes to put it, “works like gravity”.  It needs to have minimal touch points and minimal configuration to reduce the risk points. 
I considered MSIs, batch files, .NET apps, and a combination of the above with various command line utilities.  Ultimately, I decided that it was finally time to learn PowerShell.
After a headache inducing introduction, I’ve become quite comfortable with and somewhat enamored of it, for certain, sysadmin types of tasks, to the point that I’ve written initial versions of PowerShell modules in C# for the application to help simplify the automation/scripting of setting up integration configurations.  Although I didn’t completely get away from MSIs and command line utilities, PowerShell did eliminate the need for some and was able to tie the rest together much more nicely than would be possible with the old batch file.
I am by no means yet an expert, and based on some articles I've scanned I've barely scratched the surface, but over the next few blog entries will share some of the pleasure and pain I’ve experienced in working with it.
A couple of things that will greatly help you to start with.  First is Get-Help.  typing this followed by any cmdlet name will get you a brief description of the cmdlet, it’s syntax, list of arguments and related cmdlets.  Adding the –detailed argument to the Get-Help cmdlet will return detailed information on each of the arguments as well as examples.
If you don’t quite remember the name of the cmdlet, you can type in part of it and Get-Help will return a list of cmdlets containing that string.  e.g. searching on “Session” will return all of the session cmdlets.  Helpful when you forget that Get-PSSession has a “PS” in it.
Of course the next thing that will help is Google, but if you want to skip that there’s a couple sites that Google has taken me to several times:

Thursday, April 28, 2011

QUOTED_IDENTIFIER, Filtered Indexes, SSMS & SQLCMD

So I’ve been working on a project that utilizes filtered indexes and decided I needed to build an automated deployment routine.  I had built a set of build scripts, and utilizing SQLCMD mode in SSMS to allow for include files, built a master script to perform the entire build. 

During development and initial testing I ran this in SSMS and everything worked fine, but for automation purposes I used SQLCMD.EXE.  As soon as I started using SQLCMD Is started to get errors indicating that the QUOTED_IDENTIFIER was incorrectly set for indexed views, filtered indexes etc. 

Now I’m aware that indexed views among other objects are picky about their settings and the error message let me know that this was the case for filtered indexes as well.  However, the question was, why hadn’t it come up before?  In looking through the code I only found one reference where QUOTED_IDENTIFIER was set to OFF and that was in the create database script.  Even after changing that the errors were still showing up.

It turns out that by default, a connection through SSMS sets QUOTED_IDENTIFIER to ON, while a connection through SQLCMD sets it to OFF.  In SQLCMD it does this after each connect statement, so setting it at the beginning of a script may not cover it if you subsequently run a connect statement after it.  The best practice is to run the set statements after each connect.

Reading through the Remarks section of the following MSDN article,  SET QUOTED_IDENTIFIER (Transact-SQL), states that the defaults are set differently for different connection types (DB-Library, SQL Server Native Client, ODBC etc.) and thus indicates that SQLCMD and SSMS are probably using different connection types.

Tuesday, April 5, 2011

Debunking the Cult of the Machine SID

So this isn’t especially data oriented, but for any developer who is constantly creating new VMs for development or testing this info might come as a pleasant surprise.

Over the years, when cloning VMs, sometimes by simply copying the VHD files and attaching them to a new machine, we’ve been told that we’ll cause problems because we aren’t creating machines with unique SIDs.  As a result, we’ve had to use sysprep, sysinternals NewSID (discontinued) or the VM software of our choice’s cloning tool.  Turns out however, our obsession with SIDs was all for nought.  The following technet blog post by the author NewSID details why duplicate SIDs don’t matter:

The Machine SID Duplication Myth (and Why Sysprep Matters)

Note that it is still official Microsoft policy to require cloned machines to be syspreped, and as such I would recommend following that policy in a production environment, but for us developers, copy away and stop worrying about your SIDs!

Wednesday, March 23, 2011

SQL’s Choice–Helping SQL Server Pick Deadlock Victims

In my last post I show how to debug deadlocks using SQL Profiler.  That’ll help you figure out what’s causing them.  But what if for whatever reason you can’t resolve all of them?  How do I make sure that a high priority transaction isn’t chosen as the victim? 

SQL provides the answer with the SET DEADLOCK_PRIORITY statement.  You can pass it a value between –10 and 10 or the predefined values, HIGH, NORMAL or LOW that map to –5, 0 and 5 respectively.  A session with a lower value will picked as a deadlock victim over a session with a higher value. 

Below are the table and stored procedure scripts from the previous article that will allow us to create a deadlock by executing ProcedureA in one SSMS window and then immediately executing ProcedureB in a second window.

--  Create Tables
CREATE TABLE TableA(
    TableAId INT IDENTITY(1,1) NOT NULL,
    SomeValue NVARCHAR(50) NOT NULL,
)
GO

CREATE TABLE TableB(
    TableBId INT IDENTITY(1,1) NOT NULL,
    SomeOtherValue NVARCHAR(50) NOT NULL,
)
GO

-- Create Stored Procedures
CREATE PROCEDURE ProcedureA
AS
BEGIN
SET DEADLOCK_PRIORITY HIGH

BEGIN TRANSACTION

INSERT INTO TableA WITH (TABLOCKX) (
SomeValue)
VALUES (
'SomeValue A')

WAITFOR DELAY '00:00:10'

INSERT INTO TableB WITH (TABLOCKX) (
SomeOtherValue)
VALUES (
'SomeOther Value A')

COMMIT TRANSACTION
END
GO

CREATE PROCEDURE ProcedureB
AS
BEGIN
SET DEADLOCK_PRIORITY LOW

BEGIN TRANSACTION

INSERT INTO TableB WITH (TABLOCKX) (
SomeOtherValue)
VALUES (
'SomeValue B')

INSERT INTO TableA WITH (TABLOCKX) (
SomeValue)
VALUES (
'SomeOther Value B')

COMMIT TRANSACTION
END
GO


Note that the difference here is that the first statement in ProcedureA is SET DEADLOCK_PRIORITY HIGH and in ProcedureB is SET DEADLOCK_PRIORITY LOW.  This will ensure that ProcedureB will always be the victim of a deadlock between Procedures A & B. 


By placing the SET statement within the stored procedure we’ve set the deadlock priority for the stored procedure alone.  If it’s run outside the stored procedure it can be used to set the priority of an entire session.


If your interested in finding out what the current priority is you can use the following query:


SELECT 
session_id,
deadlock_priority
FROM sys.dm_exec_sessions
WHERE session_id = @@SPID


So now even if you can’t prevent all deadlocks, at least you can give your mission critical processes priority.


For more information on DEADLOCK_PRIORITY you can read on MSDN at:


SET DEADLOCK_PRIORITY (Transact-SQL)

Friday, March 18, 2011

Debugging Deadlocks with SQL Profiler

Don’t you love this:

Transaction (Process ID 60) was deadlocked on lock resources with another process and has been chosen as the deadlock victim. Rerun the transaction.

SQL helpfully tells you that your process was chosen as the deadlock victim but doesn’t tell you who “another process” was and what the deadlock was on?  Certainly makes debugging fun and exciting.  It turns out that SQL Profiler has some nice functionality for just this purpose.

First let’s find a way to reliably reproduce a deadlock.  Let’s create a couple of tables using the following script:

CREATE TABLE TableA(
    TableAId INT IDENTITY(1,1) NOT NULL,
    SomeValue NVARCHAR(50) NOT NULL,
)
GO

CREATE TABLE TableB(
    TableBId INT IDENTITY(1,1) NOT NULL,
    SomeOtherValue NVARCHAR(50) NOT NULL,
)
GO


Now lets create the following tow stored procedures:


CREATE PROCEDURE ProcedureA
AS
BEGIN
BEGIN TRANSACTION

INSERT INTO TableA WITH (TABLOCKX) (
SomeValue)
VALUES (
'SomeValue A')

WAITFOR DELAY '00:00:10'

INSERT INTO TableB WITH (TABLOCKX) (
SomeOtherValue)
VALUES (
'SomeOther Value A')

COMMIT TRANSACTION
END
GO

CREATE PROCEDURE ProcedureB
AS
BEGIN
BEGIN TRANSACTION

INSERT INTO TableB WITH (TABLOCKX) (
SomeOtherValue)
VALUES (
'SomeValue B')

INSERT INTO TableA WITH (TABLOCKX) (
SomeValue)
VALUES (
'SomeOther Value B')

COMMIT TRANSACTION
END
GO


Note that I’ve added a WAITFOR statement between the first and second INSERT statements in ProcedureA.  This will allow us to start ProcedureA in one window and give us enough time to start ProcedureB and create a deadlock in a second window.  Go ahead and give it a try.  One of them will be chosen as the deadlock victim.


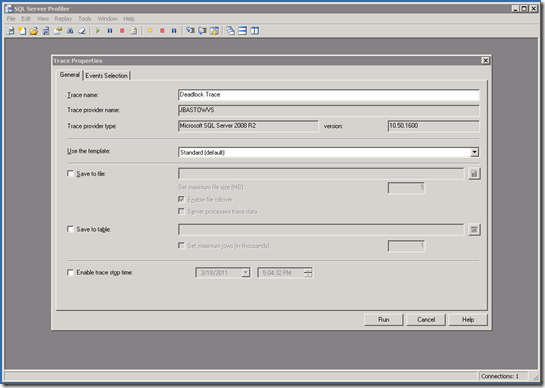
OK.  Now that we can create one ourselves, how do we go about debugging it?  First, open up SQL Profiler.  You’ll get to the initial window to define your trace:


image


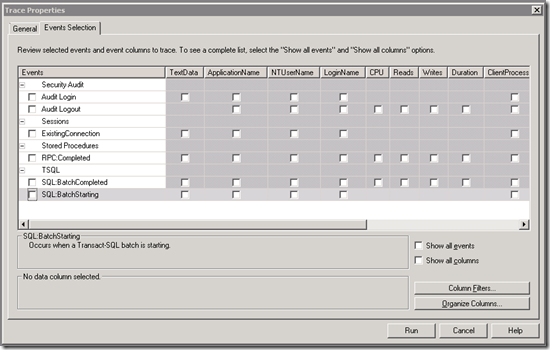
I’ve renamed mine Deadlock Trace.  Probably would have left it untitled if it hadn’t been for a blog entry.  Next go to the Event Selection tab and remove all of the existing selections as follows:


image


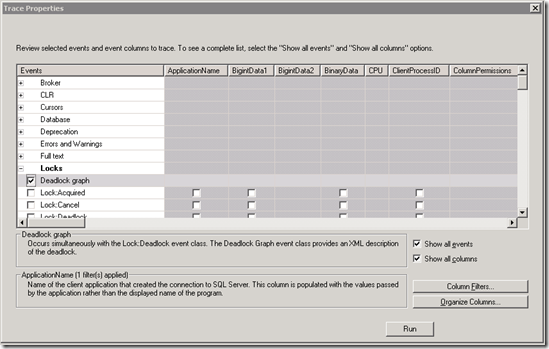
Once you have a clean slate, click on the Show all events and Show all columns checkboxes down on the lower right.  Now you can pick the deadlock graph event from under the Locks group as follows:


image


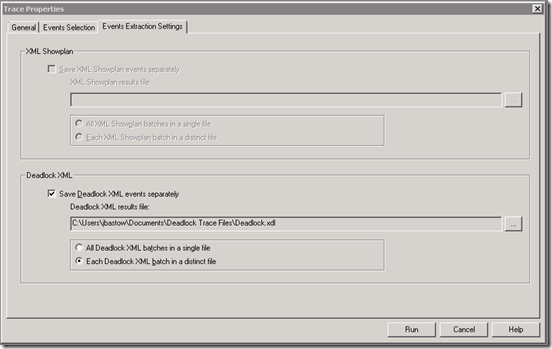
When you do this, you’ll notice that there’s now a third tab, Events Extraction Settings.  Navigate to this tab and you’ll be able to specify that profiler should write the deadlock information to a file and where as follows:


image


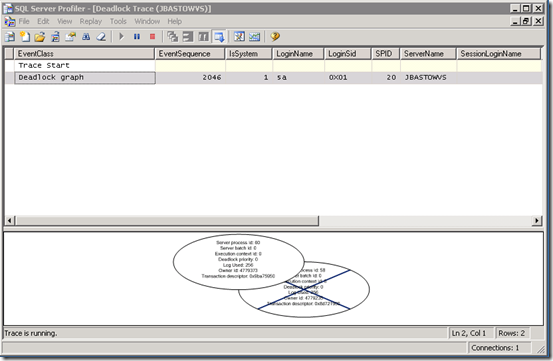
Note that I’ve chosen to have it write each deadlock to its own file.  I’ve found that to be much more convenient when reading them.  Now hit Run and off it goes.  Go back to SSMS and run our test procedures again to produce another deadlock.  When that’s completed, switch back to Profiler and you’ll see the following:


image


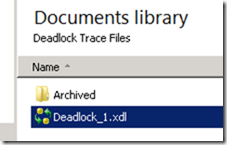
There you go.  Debug away.  OK, it’s not showing much more than we got before.  We know there were two processes, they deadlocked and one was killed.  Time to navigate explorer to the folder we told it to save the deadlocks in.  You should see a deadlock trace file as follows:


image


Now if you simply double-click on it it will open up in Profiler with the same graphical view we got above.  Since it’s just an XML file, open it up in the text/XML editor of your choice.  This file contains a wealth of information to help you resolve deadlock issues.  It’s a little large so I’m not going to include it the whole thing here but here’s some key parts:


<deadlock-list>
<deadlock victim="process4ad288">
  <process-list>
   <process id="process4ad288" clientoption2="390200" clientoption1="671090784" locktimeout="4294967295" currentdb="11" xactid="4791721" isolationlevel="read committed (2)" loginname="SILKROADTECH\jbastow" hostpid="6456" hostname="JBASTOWVS" clientapp="Microsoft SQL Server Management Studio - Query" lastbatchcompleted="2011-03-18T16:42:10.440" lastbatchstarted="2011-03-18T16:48:44.960" trancount="2" priority="0" ecid="0" sbid="0" spid="58" status="suspended" kpid="7072" schedulerid="4" lockmode="X" xdes="0x800ff950" lasttranstarted="2011-03-18T16:48:44.960" transactionname="user_transaction" ownerid="4791721" waittime="2577" waitresource="OBJECT: 11:1893581784:0 " logused="256" taskpriority="0">
    <executionstack>
     <frame sqlhandle="0x03000b00f4320d6d38a90201aa9e00000100000000000000" stmtend="568" stmtstart="368" line="13" procname="PlayPen.dbo.ProcedureA">
INSERT INTO TableB WITH (TABLOCKX) (
            SomeOtherValue)
        VALUES (
            &amp;apos;SomeOther Value A&amp;apos;)     </frame>


At the top you’ll note it specifies the specific process that was the victim.  Below that is a process list that shows the details of each process involved in the deadlock, including the stored procedure, if appropriate.  It even shows which statements within the transaction are deadlocked.


After the process list node you’ll see the resource list node.  this lists each of the objects (tables, indexes, etc.) that are locked as part of the deadlock, and the type of lock each process has, or is attempting to acquire.


<resource-list>
<objectlock lockPartition="0" objid="1893581784" subresource="FULL" dbid="11" objectname="PlayPen.dbo.TableB" id="lock80022c80" mode="X" associatedObjectId="1893581784">
  <owner-list>
   <owner id="process493708" mode="X"/>
  </owner-list>
  <waiter-list>
   <waiter id="process4ad288" mode="X" requestType="wait"/>
  </waiter-list>
</objectlock>


OK.  Now that you know how to diagnose your deadlocks, get going fixing them!


You can read more on MSDN in:


Analyzing Deadlocks with SQL Server Profiler

Tuesday, February 15, 2011

SQL Server & Windows Firewall

If you’re installing SQL Server on a machine that has Windows Firewall enabled, you’ll have to configure the firewall to open the correct ports.  For a default instance, that’s TCP 1433 for the database engine and UDP 1434 for the SQL Browser (used by client applications to retrieve the dynamic port of a non-default instance of SQL).  The following MSDN article details what needs to be configured:

Configuring the Windows Firewall to Allow SQL Server Access

(http://msdn.microsoft.com/en-us/library/cc646023(SQL.100).aspx)